Task Manager is a powerful tool in Windows that helps you monitor and manage your system’s resources. If your PC feels sluggish, knowing how to track its performance can help you identify and resolve issues. In this guide, we’ll cover everything from CPU and memory monitoring to disk and network usage tracking, ensuring you keep your system running smoothly.
Quick Links
Monitor CPU Performance
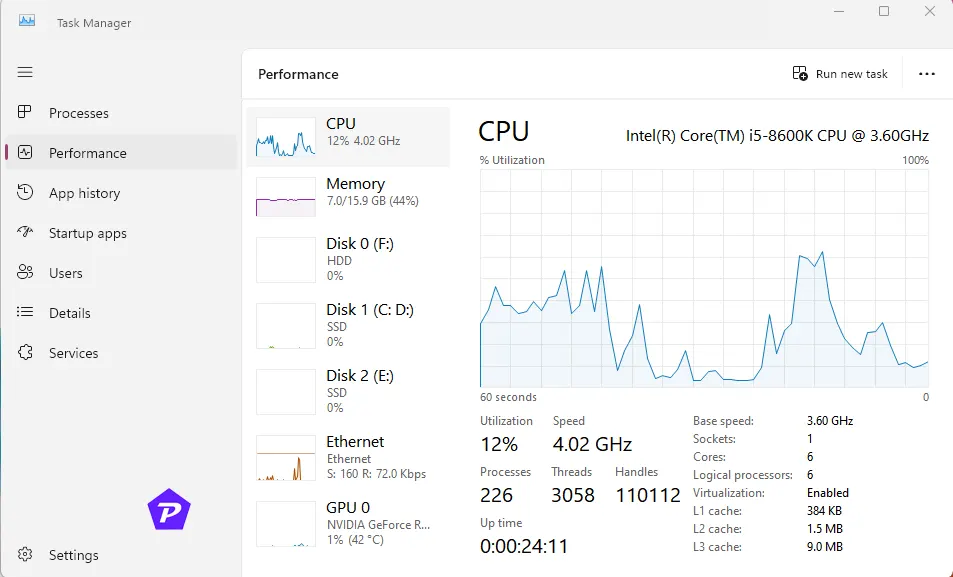
Viewing CPU Performance Data
- Go to the Performance Tab:
Click on the Performance tab in Task Manager. - Select CPU:
Choose CPU from the left sidebar. You’ll see a real-time graph displaying CPU usage.
Understanding the CPU Graph
The graph shows your CPU usage over time. Below the graph, you’ll find detailed metrics:
- Utilization: Current CPU usage percentage.
- Speed: Real-time operating speed compared to the base speed.
- Cores and Logical Processors: Number of cores and threads available.
- Processes: Total number of active processes and threads.
Identifying Resource-Hungry Applications
If your CPU usage remains high:
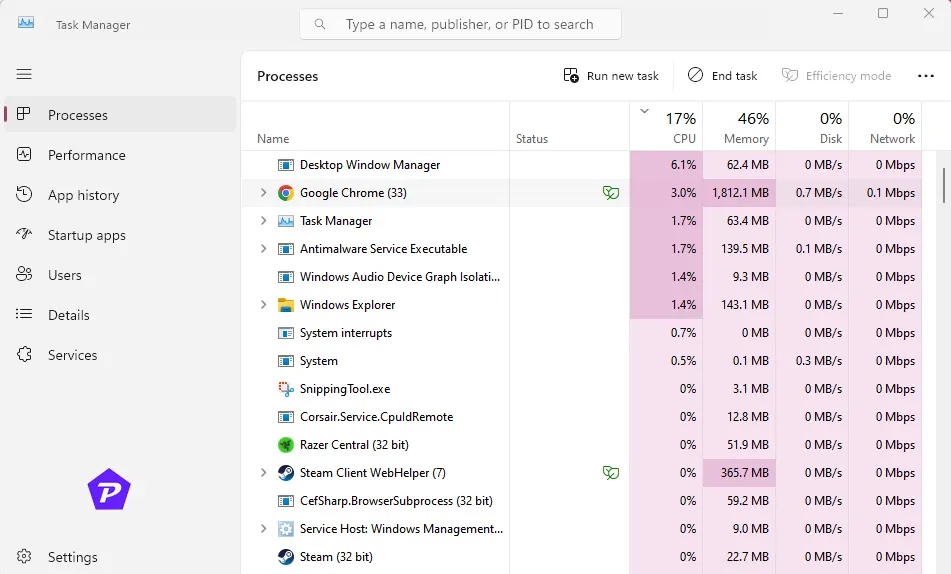
- Switch to the Processes Tab:
Click on the Processes tab. - Sort by CPU Usage:
Click the CPU column header to sort apps by their CPU consumption. - End High-CPU Tasks:
Select any misbehaving application and click End Task at the top.
Tip: Be cautious when ending tasks—closing critical system processes can cause instability.
Advanced CPU Information
Below the CPU graph, you’ll find more advanced details:
- Base Speed: The default clock speed of your CPU.
- Sockets, Cores, and Logical Processors: Understanding these can help if you plan to upgrade your hardware.
- Virtualization Support: Shows whether your CPU supports hardware virtualization, essential for running virtual machines.
Refreshing Real-Time Data
By default, Task Manager updates its data every second. You can adjust this:
- Click View at the top.
- Choose Update Speed and select High for faster updates or Paused to freeze the display.
Examine Memory Usage
Navigating to Memory Insights
- Open Task Manager.
- Go to the Performance Tab.
- Select Memory:
This section displays real-time RAM usage.
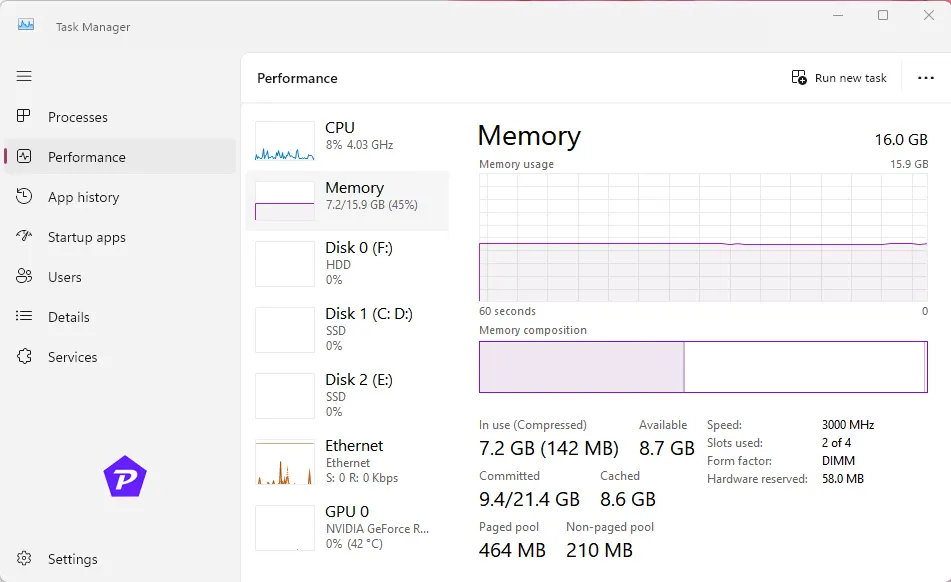
Understanding the Memory Graph
- In Use: Shows the amount of RAM currently used.
- Available: The remaining memory available for new processes.
- Committed: The total memory allocated, including virtual memory.
Identifying Memory-Intensive Applications
- Switch to the Processes Tab:
Click on Memory to sort applications by RAM usage. - Close Unnecessary Apps:
Free up RAM by closing apps you don’t need.
Committed Value and Virtual Memory
Committed memory includes both physical RAM and virtual memory. If your Committed value exceeds total RAM, Windows uses virtual memory, which is slower. This indicates it might be time for a RAM upgrade.
When to Upgrade RAM
- If your system frequently uses over 80% of its RAM.
- If you see a high Committed value compared to physical RAM.
Check Disk Space Usage
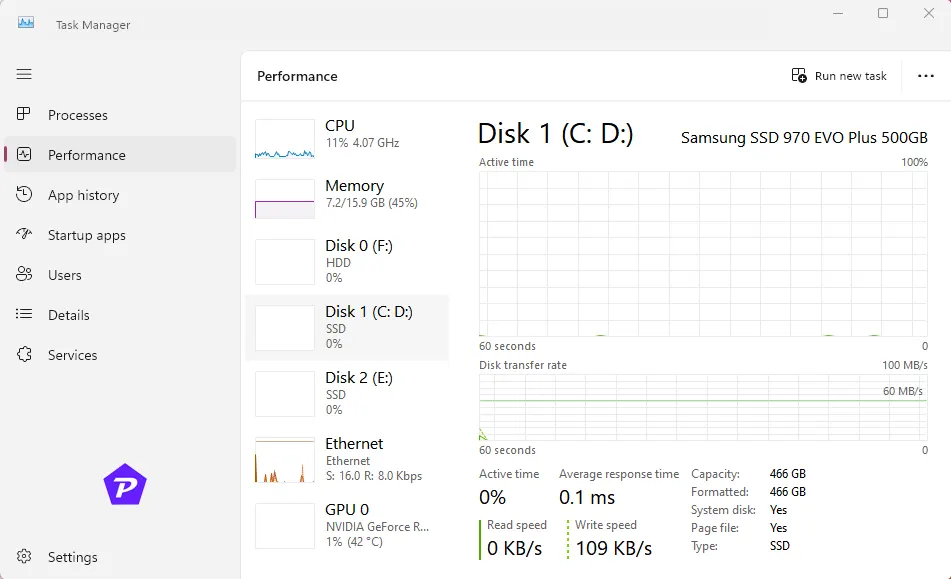
Viewing Disk Performance Data
- Go to the Performance Tab:
Select your main drive (usually Disk 0). - Read/Write Activity:
The graph shows disk activity, with read and write speeds displayed.
Managing Disk Usage
- Switch to the Processes Tab:
Sort by Disk to see which apps are using the disk the most. - Close or Manage High-Usage Apps:
End tasks or adjust settings in disk-intensive applications.
Expanding Storage Capacity
If your disk usage is consistently high:
- Delete unnecessary files.
- Uninstall unused applications.
- Upgrade to a larger SSD for faster performance and more capacity.
Analyze Network Usage
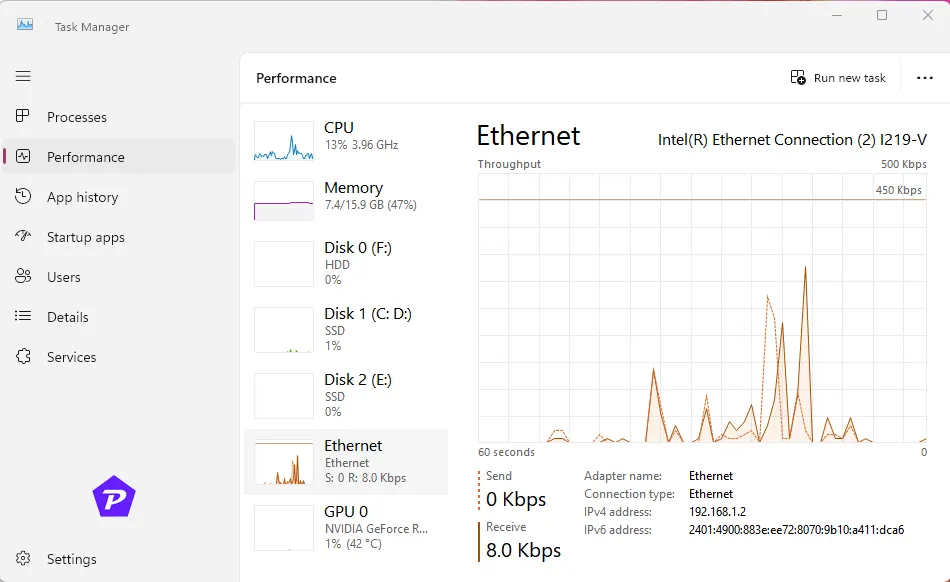
Accessing Network Performance Data
- Navigate to the Performance Tab:
Open Task Manager and select the Performance tab. - Select Ethernet or Wi-Fi:
Depending on your connection type, choose either Ethernet or Wi-Fi from the left sidebar.
Understanding Network Graphs
- Send/Receive Rates: The graph displays real-time data for upload (send) and download (receive) speeds, typically shown in Mbps.
- Adapter Details: Below the graph, you’ll find detailed information about your network adapter, IP addresses, and connection speed.
Identifying Bandwidth-Hogging Applications
- Switch to the App History Tab:
This tab provides historical data on network usage by different apps. - Sort by Network Usage:
Click on the Network column to identify apps consuming the most bandwidth.
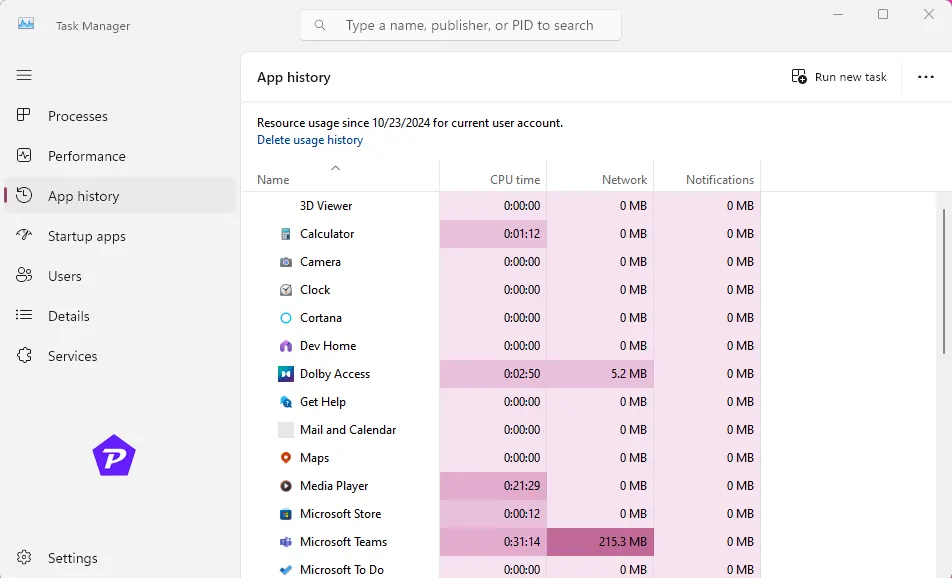
Tip: Right-click any column header to add more details, such as Downloads and Uploads, for deeper insights.
Managing Network Resources
If an application is using too much bandwidth:
- Close or Restrict the App: Use the app’s settings to limit bandwidth.
- Use Third-Party Tools: Programs like NetLimiter allow you to set bandwidth limits for specific apps.
Practical Example: If you’re downloading large files or streaming high-definition content, other apps might slow down your internet. By identifying and managing bandwidth-intensive apps, you ensure a smoother experience.
Optimizing Startup Applications
Identifying Resource-Intensive Startup Apps
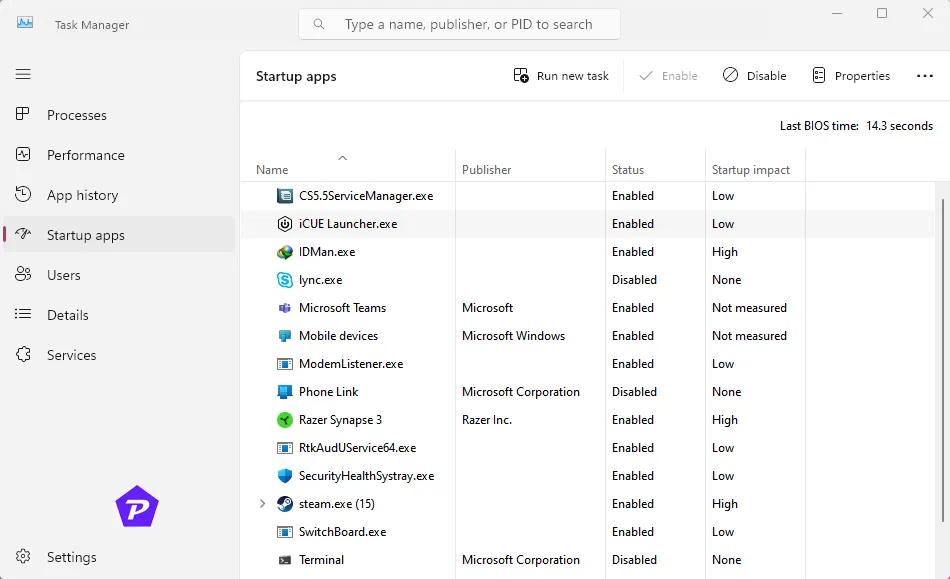
- Go to the Startup Tab:
In Task Manager, select the Startup tab to see a list of programs that launch at boot. - Check Impact Ratings:
Each app is labeled with an impact rating (High, Medium, or Low). High-impact apps can slow down startup times significantly.
Disabling or Delaying Startup Programs
- Select an App: Click on any app with a high impact.
- Disable It: Click Disable at the bottom-right corner to prevent it from starting automatically.
Pro Tip: Not all startup programs are essential. For example, cloud services like OneDrive or Dropbox may not need to launch at startup.
Benefits of Startup Optimization
- Faster Boot Times: Reducing the number of startup programs can significantly speed up the boot process.
- Better Overall Performance: Fewer background programs mean more system resources for important tasks.
Conclusion
By effectively using Task Manager, you can monitor and optimize your PC’s CPU, memory, disk, and network performance. Regularly checking these metrics helps ensure your system remains responsive and efficient.
When you purchase through links on our site, we may earn an affiliate commission. Read our Affiliate Policy.


